


Abstract
In heart failure, a reduced exercise capacity is the prevailing symptom and an important prognostic marker of future outcome. The purpose of the study was to assess the relation of coronary flow reserve (CFR) to diastolic and systolic function in heart failure and to determine which are the limiting factors for exercise capacity.
Forty-seven patients with left ventricular ejection fraction (LVEF) <35 [median LVEF 31 (inter-quartile range 26–34)] underwent cardiorespiratory exercise test with measurement of VO2 peak, a dual X-ray absorptiometry scan for body composition, and a full echocardiography with measurement of LVEF using the biplane Simpson model, mitral inflow velocities, and pulsed wave tissue Doppler. Peak coronary flow velocity (CFV) was measured in the LAD, using pulsed-wave Doppler. CFR was calculated as the ratio between peak CFV at rest and during 2 min of adenosine stress.
Fat-free-mass-adjusted VO2 peak correlated significantly with CFR (r = 0.48, P = 0.002), E/e′ (r = −0.35, P = 0.02), and s′ (r = 0.45, P = 0.001) but not with LVEF (r = 0.23, P = 0.11). CFR correlated significantly with E/e′ (r = −0.46, P = 0.003) and s′ (r = 0.36, P = 0.02), but not with LVEF (r = 0.18, P = 0.26). When adjusting for CFR in a multivariable linear model, s′ but not E/e′ remained independently associated with VO2 peak.
In this group of heart failure patients, VO2 peak was correlated with CFR, E/e′, and s′ but not with traditional measures of systolic function. CFR remained associated with VO2 peak independently of diastolic and systolic function and is likely to be a limiting factor in functional capacity of heart failure patients.
Introduction
Coronary flow reserve (CFR) reflects the impact of total coronary resistance in terms of coronary arteries and the vasodilator capacity of the microcirculation, mainly the resistance vessels. Thus, in the absence of coronary artery stenosis, CFR reflects the coronary microvascular function. CFR is impaired in idiopathic dilated cardiomyopathy1–3 and has been shown to be a prognostic marker of poor outcome.4,5 In idiopathic dilated cardiomyopathy, CFR has been associated with both left ventricular ejection fraction (LVEF)1–4 and measures of diastolic function.1,3,6,7 The relationship is not fully understood and it remains unclear whether CFR is an ‘innocent bystander’, i.e. a consequence of impaired cardiac function due to, e.g., increased wall stress or fibrosis with increased filling pressure or whether CFR plays an independent pathogenic and prognostic role.
Exercise intolerance is the prevailing symptom in heart failure, and a reduced peak oxygen uptake (VO2 peak) remains one of the most important predictors of future poor outcome.8 In healthy subjects, CFR is correlated with VO2 peak,9,10 whereas the role of CFR in exercise capacity in heart failure is not well examined, and results are conflicting. One study of 16 patients with dilated cardiomyopathy found no relationship between CFR and VO2 peak,11 and another study on 20 patients with dilated cardiomyopathy found significant correlations between VO2 peak and CFR, using positron emission tomography (PET).12 In heart failure, resting LVEF has shown only a poor correlation with VO2 peak,13 but a few studies have indicated that systolic tissue Doppler velocity (s′) is better associated with VO2 peak.14,15 Echocardiographic measures of diastolic function seem to be more closely linked to VO2 peak than systolic function.13,15
The purpose of the study was to assess the relationship between non-invasively measured CFR to diastolic and systolic function in chronic systolic heart failure and to determine what factors may, in turn, be limiting for exercise capacity.
Methods
Patients
The study was a local substudy based on patients screened for inclusion in the Smartex-HF trial16 in which patients with chronic systolic heart failure were randomized to different modalities of exercise training. The patients were recruited from the heart failure outpatient clinic at Bispebjerg University Hospital, Copenhagen, Denmark. Inclusion criteria were an LVEF <35%, being clinically stable (no signs of worsening for at least 6 weeks), minimum 3 months of optimal medical treatment, and no CRT or revascularization performed 6 months prior to inclusion. All patients had been examined with either coronary angiography or cardiac CT as part of their heart failure examination programme and were revascularized according to guidelines. All patients had to have an LAD without significant stenosis (<50%) in order to perform coronary flow measurements, but one patient had a chronic occluded LAD, which had not been revascularized due to sufficient collateral filling. Angiography was not repeated prior to the enrolment in the study. However, the participants were excluded from the study if there were signs of ischaemia or ventricular arrhythmias during the maximal symptom-limited exercise test. Five patients had an angiography without LAD stenosis performed after CFR measurement giving a median time since last angiography of 10.7 months [inter-quartile (IQ) range 5.9–29.8] for the patients with a successful CFR measurement. None of the patients had any new ischaemic events or symptoms of ischaemia since their last angiography. The patients were categorized as having heart failure of ischaemic origin if they had a myocardial infarction prior to the diagnosis of heart failure or if coronary angiography showed signs of ischaemic heart disease. The study complies with the Declaration of Helsinki and was approved by the science ethics committee for the Capital Region of Denmark (HC-2008-108). All participants gave informed written consent.
Echocardiography
A transthoracic echocardiography was performed using Philips IE33 (Philips Medical Systems, Andover, MA, USA) with an S5 probe. Left ventricle volume and LVEF were calculated from apical two- and four-chamber views, using the biplane Simpson model. Wall motion score index (WMSI) was calculated using the 16-segment model, where 1 = normal/hyperkinetic, 2 = hypokinetic, and 3 = akinetic. Pulsed-wave Doppler was used to measure transmitral peak early (E) and late (A) diastolic velocities and deceleration time of E. Pulsed-wave tissue Doppler was used to measure early (e′) and late (a′) diastolic and systolic (s′) velocities in the septal, lateral, anterior, and posterior corners of the mitral ring. Values were averaged, and the E/e′ ratio was calculated. In patients with atrial fibrillation, E, deceleration time of E isovolumetric relaxation time (IVRT), e′ and s′ were averaged over 5–10 cycles depending on how many cycles were recorded. Left atrium volume was measured in the apical four-chamber view and indexed for body surface area (BSA) calculated by Du Bois's formula (BSA = 0.007184 × weight kg0.425× height cm0.725). IVRT was measured placing a pulsed-wave sample volume between the mitral inflow and left ventricular outflow tract.
Coronary flow reserve
CFR can be measured non-invasively using transthoracic Doppler echocardiography with a high success rate,17 and this technique has been validated against invasive measurements.18 CFR was measured using a high-frequency broadband transducer (S8, Philips). All patients abstained from caffeine for 12 h before the examination and the use of dipyridamole was paused for 72 h. The LAD was located distally using colour Doppler in an apical modified two-chamber view or mid-distally, using a modified short-axis view. Coronary flow velocity (CFV) was measured using a pulsed-wave sample volume of 3–4 mm, at rest and during 2 min infusion of adenosine at 0.14 mg/kg/min with an infusion rate of 10 mL/min. The position and angle of the probe were kept unchanged during adenosine infusion to ensure that measurements were done on the same segment and angle of the LAD. CFR was calculated as the ratio between peak diastolic CFV during adenosine infusion and rest using a mean of three consecutive cardiac cycles (10 cycles if the patient had atrial fibrillation). The highest velocities during the infusion were used in the calculations. Analyses were done offline by an investigator blinded to the other examinations. Blood pressure and ECG were monitored during adenosine infusion. Interobserver variability for offline analyses of CFR was tested on all subjects and the mean difference in CFR was 0.07 with limits of agreement ±0.21 and a coefficient of variation (CV), calculated as the within-subject standard deviation divided by the mean of the observations, of 5.5%. Intraobserver variability was tested on 10 randomly selected examinations with a mean difference of 0.03, limits of agreement ±0.29, and a CV of 7.5%. Figure 1 shows a measurement of CFR.
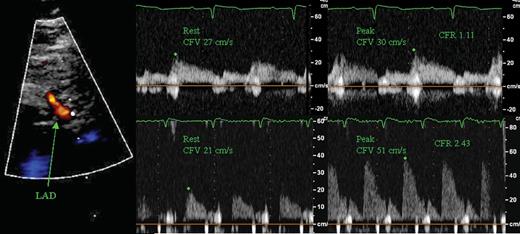
Example of CFR echocardiography. Left: colour Doppler of LAD. Pulsed-wave recording of CFV and measurement of peak CFV before and during adenosine infusion in a patient with low (top) and normal (bottom) CFR.
Body composition
A whole-body dual-X-ray absorptiometry scan (DEXA) (Lunar DPX-IQ, GE Lunar Corp, Madison, WI, USA) was performed for the estimation of body composition [fat mass and fat-free mass (FFM)]. The DEXA scanner was calibrated with a body composition phantom on each scanning day.
Cardiopulmonary exercise test
All patients underwent an upright bicycle (Via Sprint 150P, Ergoline, Bitz, Germany) exercise test with breath-by-breath gas exchange measurement (Jaeger, Masterscreen CPX, Cardinal Health, Würzburg, Germany). After 3min of rest, the test was initiated using either a protocol starting at 20 W with 10 W increase per minute or starting at 40 W with 20 W increase per minute, based on an expectation of the patients exercise capacity. The patients were encouraged to continue until maximal exhaustion. A levelling off of oxygen uptake despite increasing workload and a respiratory exchange ratio >1.05 were used as criteria for maximal oxygen uptake. The mean of the three highest consecutive 10 s measurements before exercise terminations was used for determining VO2 peak, and by using the FFM from the DEXA scan, VO2 peak is expressed (in mL/min/kg FFM).
Blood sample
N-terminal pro-brain natriuretic peptide (NT-proBNP) was analysed using EDTA plasma. Blood samples were taken in the morning after an overnight fast. Samples were cooled on ice, centrifuged for 10 min, and the plasma was transferred to microtubes and stored at −80°C. Samples were analysed by a Cobas e411 using a chemiluminescent immunoassay kit (Roche Diagnostics, Indianapolis, IN, USA).
Statistics
Unless stated otherwise, values are expressed as median and (IQ range) for continuous variables and as number (per cent) for categorical variables. Continuous variables with a normal distribution were compared using Student's unpaired t-test and variables that were not normally distributed were compared by the Mann–Whitney U-test. Differences in categorical variables were assessed using chi-squared test. Linear regression was used to test the relationship between variables, and correlations were calculated using Pearson's correlation coefficient. NT-proBNP was logarithmically transformed for correlation analyses. A multivariable analysis using standardized coefficients was performed to identify whether systolic and diastolic function and CFR were independently associated with VO2 peak. A P-value <0.05 was considered statistically significant. All analyses were performed in STATA 11.1 (StataCorp. 2009, Stata Statistical Software: Release 11, College Station, TX, USA).
Results
Table 1 shows patient characteristics. A total of 47 patients (37 men) were included in the study; 27 out of 47 were of ischaemic origin and 9 patients had atrial fibrillation. Of the 47 participants, 39 had a successful measurement of CFR (1 patient had a chronic occluded LAD, 1 patient stopped the test because of dyspnoea during adenosine infusion, and in 6 patients the image quality was poor). The median LVEF was 31 (26–34) and the median CFR was 1.77 (1.26–2.42). The median VO2 peak was 15.9 (14.1–19.1) mL/min/kg body weight and 23.7 (20.1–27.4) mL/min/kg FFM. Exercise testing and CFR measurements were all done within 1 week of each other. There were no differences in patient characteristics, systolic or diastolic function between patients with and without successful acquisition of CFR (results not shown).
Baseline patient characteristics
| Patient characteristics | n = 47 |
|---|---|
| Age | 64 (58–76) |
| BMI | 27.5 (24.4–31.4) |
| Male sex | 37 (79%) |
| Ischaemic aetiology | 26 (55%) |
| Previous MI | 22 (53%) |
| Previous PCI | 17 (36%) |
| Previous CABG | 12 (26%) |
| Type 2 diabetes | 8 (17%) |
| Atrial fibrillation | 9 (19%) |
| NYHA class | |
| II | 39 (83%) |
| III | 8 (17%) |
| Medication | |
| ACE-inhibitors or ARB | 44 (94%) |
| Beta-blockers | 45 (96%) |
| Loop diuretics | 25 (53%) |
| Aldosterone antagonists | 21 (45%) |
Values are median (IQ range) or number (%) as indicated.
BMI, body mass index; MI, myocardial infarction; PCI, percutaneous coronary intervention; CABG, coronary artery bypass graft; NYHA, New York Heart Association; ACE, angiotensin-converting enzyme; ARB, angiotensin 2 blockers.
There was no difference in CFR when comparing patients with or without diabetes or atrial fibrillation, between different NYHA groups or between patients with heart failure of ischaemic or non-ischaemic origin.
When comparing high and low CFR divided by the median (Table 2), LVEF and WMSI did not differ between the two groups, but s′ was significantly higher in patients with high CFR (4.0 vs. 4.8, P = 0.05). Measures of diastolic function were also associated with CFR. Deceleration time and IVRT were significantly higher, and E/e′, E/A, and atrium volume index were significantly lower in the patients with a higher CFR. NT-proBNP did not differ between groups.
Measurements of patients divided into groups with low and high CFR and FFM-adjusted VO2 peak by the median
| CFR | Peak oxygen uptake | |||
|---|---|---|---|---|
| Low CFR < 1.77, n = 19 | High CFR > 1.77, n = 20 | Low VO2 peak < 23.7, n = 23 | High VO2 peak > 23.7, n = 24 | |
| Age | 64 (58–80) | 65 (60–75) | 64 (58–77) | 63 (55–71) |
| NT-proBNP (pmol/L) | 115 (38–258) | 96 (40–195) | 125 (72–258) | 70 (28–149)* |
| CFR | 1.26 (1.04–1.55) | 2.39 (2.09–3.09)** | 1.49 (1.10–1.99) | 2.13 (1.68–3.09)** |
| VO2 peak (mL/min/kg FFM) | 22.1 (19.1–25.5) | 26.3 (21.1–29.7)* | 20.1 (16.8–22.1) | 27.1 (25.8–30.8)** |
| Echocardiographic measures | ||||
| LVEDD (cm) | 6.1 (6.0–6.7) | 6.1 (5.7–6.7) | 6.2 (6.0–6.7) | 6.2 (5.7–6.6) |
| E (cm/s) | 76 (65–118) | 62 (49–74)** | 76 (63–100) | 65 (56–74)** |
| A (cm/s) | 63 (45–72) | 70 (54–100) | 64 (46–82) | 72 (55–93) |
| e′ (cm/s) | 5.4 (4.7–7.1) | 5.6 (4.4–7.3) | 5.3 (4.0–7.3) | 5.6 (7.5–7.4) |
| a′ (cm/s) | 7.2 (4.7–9.0) | 8.8 (7.0–9.7) | 7.0 (4.9–8.5) | 9.0 (7.4–9.7)* |
| Systolic function | ||||
| LVEF % | 29.5 (23–34) | 31.5 (27–34) | 30 (25–34) | 31 (29–34) |
| WMSI | 2.00 (1.75–2.19) | 1.91 (1.75–2.06) | 2.00 (1.75–2.19) | 1.79 (1.75–2.00) |
| s′ (cm/s) | 4.0 (3.2–5.1) | 4.8 (4.2–5.9)* | 4.1 (3.5–5.4) | 5.0 (4.3–6.2)* |
| Diastolic function | ||||
| E/A | 1.5 (0.9–2.3) | 0.7 (0.6–1.0)** | 1.2 (0.7–2.2) | 0.8 (0.7–1.0)* |
| E/e′ | 16.4 (11.6–25.0) | 9.1 (8.2–15.4)** | 14.3 (10.6–22.3) | 10.9 (8.2–14.8)* |
| Deceleration time (ms) | 180 (140–200) | 220 (170–270)** | 180 (150–220) | 213 (175–240) |
| IVRT (ms) | 80 (60–100) | 110 (100–125)** | 87 (65–110) | 100 (85–125) |
| Atrium volume index (mL/m2) | 47.1 (40.8–58.8) | 28.0 (19.8–43.0)** | 44.7 (27.9–50.9) | 32.8 (21.8–46.8) |
Values are expressed as median (IQ range).
LVEDD, left ventricular end-diastolic diameter; E, early mitral inflow velocity; A, late mitral inflow velocity; a′, tissue Doppler late diastolic velocity; e′, tissue Doppler early diastolic velocity; LVEF, left ventricular ejection fraction; WMSI, wall motion score index; s′, tissue Doppler systolic velocity; IVRT, isovolumetric relaxation time; CFR, coronary flow reserve.
*P < 0.05.
**P < 0.01.
Table 2 also shows echocardiographic measurements of patients with high and low VO2 peak divided by the median. VO2 peak was not associated with the traditional measures of left ventricular function LVEF and WMSI, but patients with higher VO2 peak had higher s′ (5.0 vs. 4.1, P = 0.02). There was a general trend of better diastolic function in patients with higher VO2 peak, but only E/A and E/e′ were statistically significant and were higher in the patients with a low VO2 peak. CFR was significantly higher in patients with high VO2 peak (1.49 vs. 2.13, P = 0.003).
CFR and VO2 peak were strongly correlated (r = 0.48, P = 0.002) (Figure 2). Associations between diastolic and systolic function, and CFR and VO2 peak were explored in univariate analyses (Table 3). CFR was consistently associated with surrogate markers of lower left ventricular filling pressures: low E/e′, low E/A, long deceleration time, long IVRT, and smaller atrium volume index, but not with low NT-proBNP. Among systolic parameters, CFR was correlated with s′, but not with LVEF or WMSI. The correlation between CFR and atrium volume index (r = −0.34, P = 0.04) was stronger when leaving out patients with atrial fibrillation (r = −0.42, P = 0.02). LVEF and WMSI were not correlated with VO2 peak [LVEF (r = 0.23, P = 0.11), WMSI (r = −0.26, P = 0.07)], but there was a positive correlation with s′ (r = 0.45, P = 0.001). A significant correlation was seen between VO2 peak and E/A (r = −0.38, P = 0.03) and E/e′ (r = −0.35, P = 0.02), but not with other measures of diastolic function. Log NT-proBNP correlated significantly with E/e′, E/A, atrium volume index, LVEF, s′, and WMSI. All correlations were unaffected when adjusting for age and gender.
Univariate correlations between echocardiographic measurements, CFR and VO2 peak
| Correlation to CFR, n = 39 | Correlation to VO2 peak, n = 47 | |||
|---|---|---|---|---|
| R | P-value | R | P-value | |
| Log NT-pro-BNP | −0.22 | 0.17 | −0.46 | 0.001 |
| Measures of systolic function | ||||
| LVEF % | 0.18 | 0.26 | 0.23 | 0.11 |
| WMSI | −0.18 | 0.28 | −0.26 | 0.07 |
| s′ (cm/s) | 0.36 | 0.02 | 0.45 | 0.001 |
| Measures of diastolic function | ||||
| E/A | −0.51 | 0.006 | −0.38 | 0.03 |
| E/e′ | −0.46 | 0.003 | −0.35 | 0.02 |
| Deceleration time of E (ms) | 0.31 | 0.05 | 0.22 | 0.15 |
| IVRT (ms) | 0.50 | 0.002 | 0.26 | 0.10 |
| Atrium volume index (mL/m2) | −0.34 | 0.04 | −0.18 | 0.22 |
LVEF, left ventricular ejection fraction; WMSI, wall motion score index; s′, tissue Doppler systolic velocity; E/A, ratio of early and late mitral inflow velocities; E/e′, ratio between early mitral inflow velocity and early tissue Doppler velocity; IVRT, isovolumetric relaxation time.
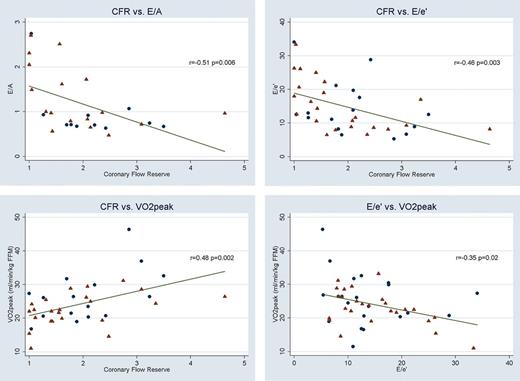
Scatter plots with linear regression lines between CFR and E/A ratio (upper left), CFR and E/e′ (upper right), CFR and VO2 peak (lower left) and E/e′ and VO2 peak (lower right). Triangles and circles indicate ischaemic and non-ischaemic aetiology, respectively.
To test whether ischaemic aetiology affected the correlations in Table 3, a multivariable regression was done for each variable, adding aetiology as a covariate, and this did not change the estimates. Also, there were no signs of interaction. The same was done for atrial fibrillation to test whether this could be a confounder, and again the estimates did not change, and there were no signs of interaction. When dividing the patients into two groups by aetiology, CFR and VO2 peak remained significantly correlated in both groups also after adjusting for age and gender.
A multivariable analysis was performed to assess the independent predictive value of systolic and diastolic function and CFR on VO2 peak. As measures of systolic and diastolic function, s′ and E/e′ were chosen based on correlations in Table 3. E/e′ was chosen over E/A to include the patients with atrial fibrillation in the analysis. When adjusting for CFR, the association between s′ and VO2 peak was attenuated but remained statistically significant. E/e′, however, was no longer significantly associated with VO2 peak after adjusting for CFR (P = 0.09) (Table 4). CFR remained independently associated with VO2 peak regardless of systolic and diastolic function.
Regression models with fat-free-mass-adjusted VO2 peak as the dependent variable and s′, E/e′, and CFR as explanatory variables
| Variable | SC for s′ | SC for E/e′ | SC for CFR | ||||||
|---|---|---|---|---|---|---|---|---|---|
| SC | 95% CI | P-value | SC | 95% CI | P-value | SC | 95% CI | P-value | |
| Unadjusted | 2.94 | 1.21–4.67 | 0.001 | −2.27 | −4.08 to −0.45 | 0.02 | 3.07 | 1.19–4.95 | 0.002 |
| Adjusted for CFR | 2.47 | 0.64–4.30 | 0.009 | −1.67 | −3.61 to 0.27 | 0.09 | – | – | – |
| Adjusted for E/e′ | – | – | – | – | – | – | 2.24 | 0.17–4.32 | 0.03 |
| Adjusted for s′ | – | – | – | – | – | – | 2.16 | 0.30–4.02 | 0.02 |
CFR, coronary flow reserve; CI, confidence interval; E/e′, early mitral inflow velocity divided by early diastolic tissue Doppler velocity; s′, systolic tissue Doppler velocity; SC, standardized coefficient.
Discussion
In this study, which is the first to simultaneously assess the role of systolic and diastolic function and coronary microvascular function in predicting exercise capacity in heart failure, we found that CFR, diastolic function, and s′, but not LVEF and WMSI, were all associated with VO2 peak. After mutual adjustment, CFR and s′ remained independent predictors of VO2 peak.
In the present study, diastolic impairment assessed by E/e′ predicted a poorer VO2 peak. Previous studies have shown a good correlation between VO2 peak and diastolic function measured using transmitral inflow pattern and tissue Doppler velocities,15,19 and studies indicate that echocardiographic measures of diastolic function are better predictors of VO2 peak than LVEF in systolic heart failure.13 Especially, a restrictive left ventricular inflow pattern and high E/e′, which is known to reflect diastolic filling pressure in systolic dysfunction, have been inversely related to VO2 peak.15 Additionally, in a study of heart failure patients undergoing exercise training, the improvement in VO2 peak was inversely correlated with changes in E/e′.20
We found no correlation between LVEF and WMSI to VO2 peak. This is consistent with other studies showing a weak or no relationship between resting LVEF and VO2 peak in heart failure patients.13–15,19 However, VO2 peak was strongly correlated with s′, which may simply indicate that the average of s′ from four segments is a more robust marker of global systolic function than LVEF and WMSI. LVEF has great prognostic significance in heart failure, but it can be difficult to measure reproducibly because of image quality and the fact that it is load dependent. s′ can be easier to measure despite poor image quality and is not load dependent. Other studies have also found s′ to be a better predictor of VO2 peak than LVEF in heart failure patients.14,15
We found a clear relationship between CFR and diastolic function, with patients with a more restrictive filling pattern having a lower CFR. This is in concordance with other studies on patients with idiopathic dilated cardiomyopathy.1,3,7 Studies have shown that, in dilated cardiomyopathy, there is an association between elevated filling pressure and high end-diastolic wall stress, which is seen in patients with restrictive filling pattern.1,2,21 In heart failure patients, reduced CFR may thus reflect higher wall stress rather than properties intrinsic to coronary vessels, e.g. endothelial function. However, CFR was not correlated with NT-proBNP, known to be a strong measure of wall stress, but NT-proBNP can be affected by age, renal function, and medication and it is therefore difficult to interpret. Other mechanisms to link CFR and diastolic function include that in patients with a reduced CFR, regional ischaemia may result, when oxygen demands increase. One study using PET showed a switch from aerobic to anaerobic metabolism during stress in parts of the myocardium where CFR was low.22 This could lead to a vicious circle of increased wall stress causing impaired CFR again leading to repeated ischaemia and myocardial fibrosis. Increased myocardial fibrosis leads to left ventricular stiffness and is associated with diastolic dysfunction,23,24 but a direct link between myocardial fibrosis and CFR has not been shown yet. One study has shown an inverse correlation between serum C-terminal propeptide of procollagen type I, which is a biochemical marker of myocardial fibrosis, and CFR in hypertensive patients.25
A relationship between CFR and E/e′ has been shown in other patient categories such as hypertension,26 and in patients with risk factors of cardiovascular disease, a low CFR was associated with signs of diastolic dysfunction.27 This could indicate that a relationship between diastolic dysfunction and CFR is present early in cardiac disease, and that a reduction in CFR might precede the onset of diastolic dysfunction. In fact, an impaired coronary microcirculation might in part be responsible for the development of diastolic dysfunction. A preponderance of diastolic dysfunction in patients with diabetes28 and an association between the degree of insulin resistance and CFR29 have been shown in previous studies and may reflect this linkage.
When we adjusted for CFR in the model with VO2 peak as the dependent and s′ as the explanatory variable, the regression coefficient of s′ diminished, but was still statistically significant. When we did the same in the model with VO2 peak as the dependent and E/e′ as the explanatory variable, the regression coefficient of E/e′ diminished and was no longer statistically significant. Thus, whereas only a minor part of the relationship between s′ and VO2 peak can be ‘explained’ by CFR, the well-established relationship between E/e′ and VO2 peak is significantly weakened by adjusting for CFR. Conclusions, however, must be drawn cautiously due to the low sample size and lack in precision of echocardiographic measures. Nonetheless, the data support that CFR has a strong relationship to VO2 peak regardless of diastolic or systolic function.
Limitations
The patients all had an LAD without significant stenosis at a previous coronary angiography or coronary CT scan, but the examination was not repeated at the time of the study, meaning that some of the patients potentially could have developed a significant LAD stenosis. All of the patients did, however, perform a maximal symptom-limited exercise test at enrolment in the study without chest pain or signs of ischaemia on the ECG, minimizing the chances of a significant LAD stenosis. None of the patients had any new ischaemic event or signs of ischaemia since their last angiography. Only four-chamber view was used in calculating left atrium volume, and not the biplane model as recommended in current guidelines.
Conclusion
In heart failure patients, CFR and systolic function (s′) are independently associated with VO2 peak, suggesting that these are both limiting factors in functional capacity. Further studies will clarify whether the beneficial effects of exercise in heart failure involve improvement in CFR and s′.
Conflict of interest: none declared.
Funding
This work was supported by The Danish Research Council (09-065525/FSS).
