


Abstract
The variability of ejection fraction (EF) poses a problem in the assessment of left ventricular (LV) function in patients receiving potentially cardiotoxic chemotherapy. We sought to use global longitudinal strain (GLS) to compare LV responses to various cardiotoxic chemotherapy regimens and to examine the response to cardioprotection with beta-blockers (BB) in patients showing subclinical myocardial damage.
We studied 159 patients (49 ± 14 year, 127 women) receiving anthracycline (group A, n = 53, 46 ± 17 year), trastuzumab (group T, n = 61, 53 ± 12 year), or trastuzumab after anthracyclines (group AT, n = 45, 46 ± 9 year). LV indices [ejection fraction (EF), mitral annular systolic velocity, and GLS] were measured at baseline and follow-up (7 ± 7 months). Patients who decreased GLS by ≥11% were followed for another 6 months; initiation of BB was at the discretion of the clinician. Anthracycline dose was similar between group A and group AT (213 ± 118 vs. 216 ± 47 mg/m2, P = 0.85). Although ΔEF was similar among the groups, attenuation of GLS was the greatest in group AT (group A, 0.7 ± 2.8% shortening; T, 1.1 ± 2.7%; and AT, 2.0 ± 2.3%; P = 0.003, after adjustment). Of 52 patients who decreased GLS by ≥−11%, 24 were treated with BB and 28 were not. GLS improved in BB groups (from −17.6 ± 2.3 to −19.8 ± 2.6%, P < 0.001) but not in non-BB groups (from −18.0 ± 2.0 to −19.0 ± 3.0%, P = 0.08). Effects of BB were similar with all regimens.
GLS is an effective parameter for identifying systolic dysfunction (which appears worst with combined anthracycline and trastuzumab therapy) and responds to cardioprotection in patients administered beta-blockers.
Introduction
Because many cancer chemotherapeutic agents have significant potential for cardiovascular side effects, many of the increasing numbers of cancer survivors are at risk for the development of heart failure.1–3 Anthracyclines are among the most effective drugs against cancer, used in a wide spectrum of malignancies, both in adjuvant and metastatic settings. In women with human epidermal growth factor receptor type 2 (HER2) positive breast cancers, trastuzumab has substantially improved overall survival and reduced the risk of disease recurrence.4–6 However, the combination of trastuzumab and anthracyclines increases the risk of cardiotoxicity.
There are two potential, non-exclusive strategies for reducing the risk of anthracycline-related cardiotoxicity. The use of prophylactic agents may reduce this risk but requires treatment of all patients to avoid the development of heart failure in a handful.7 The alternative approach is to monitor all patients and treat those who show an abnormal cardiac response. Echocardiography is widely used to assess changes in left ventricular (LV) function during cancer treatment,3 and EF is standard measurement for this purpose. However, several problems are posed by the use of this parameter. It has a significant test–retest variation8—although this can be minimized by the use of 3D imaging8—and it is insensitive to mild dysfunction. The latter has been addressed by the use of deformation parameters such as strain and strain rate as a useful means to detect subclinical myocardial dysfunction.9–11 However, the most appropriate response to the reduction in myocardial deformation with treatment is undefined. A variety of cardioprotective agents, including angiotensin-converting enzyme inhibitors (ACEi) and beta-blockers (BB), are recommended in patients who are asymptomatic but demonstrate impaired LV function (stage B heart failure),12 but many cancer survivors with LV dysfunction do not receive treatment consistent with heart failure guidelines.13 The evidence of effectiveness of BB and ACEi in this specific setting is limited,14,15 and a means of tracking response to therapy would be desirable. Accordingly, we sought (1) to elucidate how different regimens affect EF or deformation parameters and (2) to evaluate the effect of BB in patients who develop LV dysfunction during treatment.
Methods
Study design
We prospectively enrolled 159 consecutive patients who were initiated on anthracyclines, trastuzumab, or both, as part of cancer chemotherapy at Cleveland Clinic, USA, and Princess Alexandra Hospital, Brisbane, Australia. Patients treated with BB at baseline were excluded. All the patients underwent at least three echocardiograms (baseline and 2 follow-up studies). The study was approved by the Institutional Review Board of both institutions, and written informed consent was gathered for studies obtained outside of usual medical care. The authors had full access to and take responsibility for the integrity of the data.
This study consisted of two parts (Figure 1). All patients were followed ∼6 months to elucidate the difference in the effect of three cancer regimens on cardiac function. Based on our previous work,16 patients with stable GLS (ΔGLS < 11%) at 6 months were assigned only to the initial observational study. Patients who developed Δ global longitudinal strain (GLS) ≥11% were further followed another 6 months, because this population is prone to have subsequent decrease in EF at 12 months.16 The primary outcome variable was change in EF at 12 months.
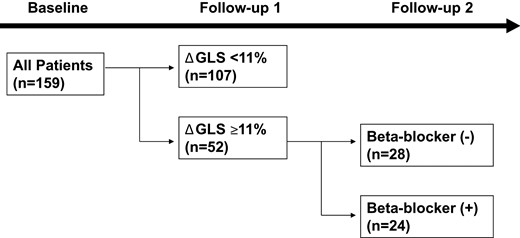
Study design. The study involved 159 patients who underwent conventional and strain echocardiography at baseline and two follow-ups. At the first follow-up, the patients with ΔGLS ≥11% were further divided into two groups (with or without beta-blocker). GLS, global longitudinal strain.
Chemotherapy regimens
Anthracyclines were administered between the baseline echocardiography and the first follow-up (Figure 1). The duration of anthracycline therapy varied by diagnosis—most patients had breast cancer, and these were administered anthracycline for four cycles with two-week intervals. The anthracycline dose was converted to the dose equivalent to doxorubicin and indexed by body surface area then compared between the groups A and AT. Trastuzumab (the dose of which was determined by body weight) was continuously administered every three weeks for 1 year in groups T and AT. The median duration between last dose of anthracycline and first dose of trastuzumab in group AT was 14 days [(inter-quartile range (IQR), 14, 15].
Beta-blocker therapy
Patients with abnormal GLS response were divided into two groups based on the administration of BB. This was a non-randomized observational study, so the initiation of BB was left to the discretion of the patients attending physician. As some but not all prescribed BB based on the deterioration of GLS at follow-up 1, we had access to treated and untreated patients who did not differ significantly. BB were continued throughout the study period. Chemotherapy was continued in these patients, regardless of beta-blocker therapy.
Echocardiography
Echocardiography was performed using standard commercial echocardiographic systems (Vivid 7 and E9, GE Medical, Milwaukee, WI, USA). Sector size and depth were adjusted to achieve optimal visualization of all LV myocardium at the highest possible frame rate. Acquisition was obtained at end-expiration. Multiple consecutive cardiac cycles of the three standard apical views were acquired and stored digitally for subsequent analysis. EF was calculated using the biplane method of disks17 and traced at least twice by an experienced single observer.18 Tissue Doppler-derived indices were measured using the apical four-chamber view. Peak systolic (s′) and early diastolic (e′) mitral annular velocities were calculated by averaging septal and lateral mitral annular velocities. All the myocardial deformation measurements were performed offline, using a commercially available software (EchoPAC-PC v11.0.0, GE Medical, Milwaukee, WI). Three apical views were used to obtain GLS by a single operator.19,20 The adequacy of tracking was verified manually, and the region of interest was readjusted to achieve optimal tracking. Per cent change (Δ) was calculated between baseline and 6 months. The intra- and inter-observer intraclass coefficients for GLS were evaluated in 10 random subjects and were 0.71 [coefficient of variation (CV) 7.1%] and 0.85 (CV 5.7%), respectively.
Statistical analysis
Continuous data are presented as mean ± standard deviation, and categorical data are expressed as percentages. Student's t-test, paired t-test, and Mann–Whitney U test were used to compare continuous variables when appropriate. Chi-square and Fisher exact tests were applied to compare categorical variables when appropriate. Multiple comparisons among the three regimen groups were performed by analysis of variance (ANOVA) followed by the Tukey–Kramer post-hoc test. Multiple linear regression analysis was used for adjusting with other possible confounders. Two-way repeated measures ANOVA (with time set as repeated factor) was used for the comparison between with and without BB treatment. When sphericity was not assumed, Greenhouse–Geisser correction was used.21 As there was a significant difference between the age of the patients with and without beta-blockers, multiple linear regression analysis was used to adjust ΔEF (from the first follow-up to the second) for age, gender, and chemotherapy regimen. Owing to the limited sample size, the confidence interval of the unstandardized coefficient was obtained by 1000 times bootstrapping. Statistical analyses were performed with IBM SPSS statistics (version 20.0.0, SPSS Inc, Chicago, IL, USA) and JMP pro (version 9.0.0, SAS Institute Inc, Cary, NC, USA). All P values reported are from two-sided tests, and P < 0.05 was considered statistically significant.
Results
Patient characteristics
The clinical characteristics are summarized in Table 1. Among all patients, 53 (33%) received anthracyclines only (group A), 61 (39%) trastuzumab only (group T), and 45 (28%) trastuzumab after anthracyclines (group AT). The maximal cumulative doses of anthracyclines did not differ between the groups (A, 213 ± 118 mg/m2; AT, 216 ± 47; P = 0.85). As the patients who received trastuzumab for breast cancer (groups T and AT) were all female, frequencies of gender and radiation were different among the three different regimen groups. Dyslipidaemia was less frequent in group AT. Although heart rate was similar among the groups, mitral annulus velocities were faster in group A, reflecting the larger cardiac volumes owing to the inclusion of men.
Clinical and echocardiographic characteristics of all patients
| All (n = 159) | Group A (n = 53) | Group T (n = 61) | Group AT (n = 45) | P valuea | |
|---|---|---|---|---|---|
| Age | 49 ± 14 | 46 ± 17 | 53 ± 12 | 46 ± 9 | 0.0049 |
| Female, n (%) | 127 (80) | 21 (40) | 61 (100) | 45 (100) | <0.001 |
| Hypertension, n (%) | 32 (20) | 11 (21) | 16 (26) | 5 (11) | 0.16 |
| Diabetes, n (%) | 9 (6) | 2(4) | 6 (10) | 1 (2) | 0.19 |
| Dyslipidaemia, n (%) | 29 (18) | 14 (26) | 13 (21) | 2 (4) | 0.014 |
| Smoking, n (%) | 60 (38) | 26 (49) | 19 (32) | 15 (33) | 0.11 |
| Radiation, n (%) | 57 (36) | 3 (6) | 26 (43) | 28 (62) | <0.001 |
| ACE-I or ARB | 20 (13) | 6 (11) | 12 (20) | 2 (4) | 0.06 |
| Anthracyclines, n (%) | 98 (62) | 53 (100) | 45 (100) | ||
| Doxorubicin | 67 (42) | 33 (62) | 34 (76) | ||
| Epirubicin | 12 (8) | 1 (2) | 11 (24) | ||
| Daunorubicin | 9 (6) | 9 (17) | 0 | ||
| Idarubicin | 7 (4) | 7 (13) | 0 | ||
| Mitoxantrone | 3 (1) | 3 (6) | 0 | ||
| Diseases | |||||
| Breast cancer | 111 (70) | 5 (9) | 61 (100) | 45 (100) | |
| Leukemia | 18 (11) | 18 (34) | |||
| Lymphoma | 18 (11) | 18 (34) | |||
| Sarcoma | 10 (6) | 10 (19) | |||
| Others | 2 (2) | 2 (4) | |||
| Heart rate | 76 ± 15 | 77 ± 16 | 75 ± 15 | 76 ± 12 | 0.86 |
| Systolic function | |||||
| EDV (mL) | 93 ± 29 | 112 ± 37 | 79 ± 17 | 87 ± 19 | <0.0001 |
| ESV (mL) | 36 ± 13 | 44 ± 18 | 30 ± 7 | 34 ± 8 | <0.0001 |
| EF (%) | 62 ± 3.9 | 61 ± 4 | 62 ± 4 | 62 ± 3 | 0.63 |
| s′ (cm/s) | 8.9 ± 2.2 | 9.9 ± 2.6 | 8.3 ± 1.8 | 8.5 ± 2.0 | 0.0028 |
| GLS (%) | −20.6 ± 2.4 | −20.6 ± 2.3 | −20.7 ± 2.6 | −20.5 ± 2.3 | 0.90 |
| Diastolic function | |||||
| e′ (cm/s) | 10.4 ± 3.2 | 11.2 ± 3.0 | 9.4 ± 3.2 | 11.0 ± 3.2 | 0.0041 |
| E wave (cm/s) | 80 ± 19 | 82 ± 20 | 79 ± 21 | 79 ± 15 | 0.40 |
| A wave (cm/s) | 74 ± 21 | 72 ± 21 | 77 ± 24 | 71 ± 16 | 0.47 |
| E/A ratio | 1.1 ± 0.4 | 1.2 ± 0.4 | 1.1 ± 0.3 | 1.2 ± 0.3 | 0.09 |
| DT (msec) | 203 ± 44 | 213 ± 46 | 199 ± 37 | 202 ± 51 | 0.06 |
| LV response | |||||
| ΔEF | −3.6 ± 5.6 | −2.9 ± 4.9 | −3.9 ± 4.8 | 0.60 (0.34)b | |
| ΔGLS (%) | 0.7 ± 2.8 | 1.1 ± 2.7 | 2.0 ± 2.3 | 0.07 (0.003)b | |
| Δs′ (cm/s) | −0.5 ± 2.5* | −0.5 ± 1.6* | −1.6 ± 1.9 | 0.034 (0.076)b | |
| Δe′ (cm/s) | −0.7 ± 2.8* | 0.01 ± 2.1* | −1.9 ± 2.2 | <0.001 (0.019)b | |
aP value for one way ANOVA bAdjusted for baseline differences in age, hypertension, dyslipidaemia, radiation, ACE-I/ARB, and EDV. *P < 0.05 vs. group AT.
ACE-I, angiotensin-converting enzyme inhibitor; ARB, angiotensin receptor blocker; DT, deceleration time of mitral inflow; EF, ejection fraction; e′, mitral annular diastolic velocity; GLS, global longitudinal strain; Group A, patients with anthracyclines only ;Group T, patients with trastuzumab only; Group AT, patients with trastuzumab after anthracyclines; s′, mitral annular systolic velocity
Changes from baseline to the first follow-up
The median duration between baseline echocardiography and first follow-up (F/U1) was 160 days (IQR 118, 213). In crude comparison, ΔEF (P = 0.60) and ΔGLS (P = 0.07) were similar among the treatment groups and Δs′ (P = 0.034) and Δe′ (P < 0.001) were significantly reduced in group AT (Table 1). As some baseline characteristics varied among the groups at baseline, all four echocardiographic parameters were adjusted with age, hypertension, dyslipidaemia, radiation, ACEi/ARB and baseline resting end-diastolic volume. Although there were no significant difference in ΔEF (P = 0.34) and Δs′ (P = 0.076), ΔGLS became significantly different among treatment groups after the adjustment (P = 0.003) and Δe′ remained significant (P = 0.019).
Patients with reduced myocardial deformation
Of the 159 patients observed, 52 (33%) patients developed abnormal GLS (ΔGLS≥11%) at F/U1. Their absolute GLS and EF were −21.8 ± 2.1 and 62.1 ± 3.7% at baseline and −17.8 ± 2.1 and 55.3 ± 5.6% at follow-up 1, respectively. There were 14 patients who had >10 point decrease in EF to <0.55. Among them, 12 (23%) received anthracyclines only, 22 (42%) trastuzumab only, and 18 (35%) both. The clinical characteristics of patients with reduced myocardial deformation are summarized in Table 2. As no patients were treated with radiation in group A, the frequency of radiation was significantly different among the groups. As was the case with the whole population, cardiac volumes and mitral annulus velocities were greater in group A. These patients were further followed after a median of 115 days (IQR 84, 180). At the discretion of their physician, 24 patients were initiated on BB—two with metoprolol (25 and 50 mg) and 22 with carvedilol [median dose 10 mg (IQR 6.25, 25 mg)].
Characteristics of patients with an abnormal GLS response
| All (n = 52) | Group A (n = 12) | Group T (n = 22) | Group AT (n = 18) | P value | |
|---|---|---|---|---|---|
| Age | 47 ± 13 | 42 ± 18 | 53 ± 12 | 43 ± 8 | 0.02 |
| Female, n (%) | 42 (81) | 2 (17) | 22 (100) | 18 (100) | <0.0001 |
| Hypertension, n (%) | 10 (19) | 1 (8) | 8 (36) | 1 (6) | 0.027 |
| Diabetes, n (%) | 3 (6) | 0 (0) | 2 (9) | 1 (6) | 0.55 |
| Dyslipidaemia, n (%) | 7 (13) | 2 (17) | 5 (23) | 0 (0) | 0.10 |
| Smoking, n (%) | 27 (52) | 9 (75) | 7 (32) | 11 (61) | 0.03 |
| Radiation, n (%) | 19 (37) | 0 (0) | 9 (41) | 10 (56) | 0.007 |
| Anthracyclines, n (%) | 30 (58) | 12 (100) | 18 (100) | ||
| Doxorubicin | 19 (36) | 3 (25) | 16 (89) | ||
| Epirubicin | 3 (6) | 1 (8) | 2 (11) | ||
| Daunorubicin | 5 (10) | 5 (42) | |||
| Idarubicin | 2 (4) | 2 (17) | |||
| Mitoxantrone | 1 (2) | 1 (8) | |||
| Diseases | |||||
| Breast cancer | 40 (77) | 0 (0) | 22 (100) | 18 (100) | |
| Leukemia | 8 (15) | 8 (67) | |||
| Lymphoma | 2 (4) | 2 (17) | |||
| Sarcoma | 1 (2) | 1 (8) | |||
| Other | 1 (2) | 1 (8) | |||
| Heart rate | 76 ± 14 | 75 ± 16 | 76 ± 14 | 78 ± 14 | 0.94 |
| EDV (mL) | 97 ± 30 | 131 ± 34 | 79 ± 15 | 96 ± 20 | <0.0001 |
| ESV(mL) | 37 ± 13 | 52 ± 15 | 30 ± 6 | 36 ± 9 | <0.0001 |
| EF (%) | 62 ± 4 | 61 ± 3 | 63 ± 4 | 62 ± 4 | 0.27 |
| s′ (cm/s) | 9.2 ± 1.9 | 10.7 ± 2.4 | 8.6 ± 1.6 | 9.1 ± 1.8 | 0.06 |
| e′ (cm/s) | 10.8 ± 3.1 | 12.4 ± 3.8 | 9.8 ± 2.9 | 11.0 ± 2.7 | 0.09 |
| GLS (%) | −21.8 ± 2.1 | −21.5 ± 2.1 | −22.1 ± 2.0 | −21.6 ± 2.2 | 0.71 |
| Beta-blocker, n (%) | 24 (46) | 5 (42) | 9 (41) | 10 (56) | 0.61 |
Abbreviations as in Table 1.
Responses of patients with reduced myocardial deformation
Baseline clinical characteristics of patients who received and did not receive BB during therapy were comparable except for age (P = 0.02) (Table 3). Baseline EF (P = 0.34), GLS (P = 0.71), s′ (P = 0.42), and e′ (P = 0.18) were similar between the patients with and without BB. After initiation of BB, EF rose (P < 0.001), whereas there was a decreasing trend in patients without BB treatment (P = 0.06) (Table 4, Figure 2). GLS significantly improved in the patients with BB (P < 0.001) but did not without BB (P = 0.08) (Figures 3 and 4). After adjusting with age, hypertension, dyslipidaemia, and the three chemotherapy regimens, beta-blocker therapy remained significantly associated with the increase in EF from 6 to 12 months [β = 5.2 (95% CI 3.1, 7.3), P < 0.001]. As our sample size was limited, confidence interval for beta was confirmed with 1000 bootstrap [bootstrapped β = 5.2 (95% CI 3.5, 7.0), P = 0.001]. In addition, after adjusting for age, hypertension, radiation, and the three chemotherapy regimens, beta-blocker therapy still remained significantly associated with the increase in EF from 6 to 12 months [β = 5.7 (95% CI 3.3, 8.1), P < 0.001].
Patient characteristics of patients with reduced strain on therapy
| All (n = 52) | BB(−) (n = 28) | BB(+) (n = 24) | P value | |
|---|---|---|---|---|
| Age | 47 ± 13 | 52 ± 13 | 42 ± 13 | 0.015 |
| Heart rate | 76 ± 14 | 79 ± 15 | 74 ± 13 | 0.40 |
| Hypertension | 10 (19) | 8 (29) | 2 (8) | 0.06 |
| Diabetes | 3 (6) | 2 (7) | 1 (4) | 0.65 |
| Dyslipidaemia | 7 (13) | 6 (21) | 1 (4) | 0.07 |
| Smoking | 27 (52) | 13 (46) | 14 (58) | 0.39 |
| Radiation | 19 (37) | 12 (43) | 7 (29) | 0.31 |
| ACE-I or ARB | 8 (15) | 5 (18) | 3 (13) | 0.59 |
| Anthracycline use | 30 (58) | 15 (54) | 15 (63) | 0.42 |
| Doxorubicin | 19 (36) | 9 (32) | 10 (42) | |
| Epirubicin | 3 (6) | 3 (11) | 0 (0) | |
| Daunorubicin | 5 (10) | 2 (7) | 3 (13) | |
| Idarubicin | 2 (4) | 0 (0) | 2 (8) | |
| Mitoxantrone | 1 (2) | 1 (4) | 0 (0) |
Abbreviations as in Table 1.
Changes in echocardiographic indices between F/U1 and F/U2
| BB(−) (n = 28) | P value* | BB(+) (n = 24) | P value* | |||||
|---|---|---|---|---|---|---|---|---|
| Baseline | F/U1 | F/U2 | Baseline | F/U1 | F/U2 | |||
| EF (%) | 62.5 ± 3.9 | 56.7 ± 5.4 | 55.6 ± 5.0 | 0.06 | 61.5 ± 3.5 | 53.6 ± 5.4 | 57.8 ± 5.5 | <0.001 |
| GLS (%) | −21.7 ± 1.7 | −18.0 ± 2.0 | −19.0 ± 3.0 | 0.08 | −21.9 ± 2.5 | −17.6 ± 2.3 | −19.8 ± 2.6 | <0.001 |
| s′ (cm/s) | 9.4 ± 1.9 | 7.5 ± 1.5 | 7.2 ± 1.5 | 0.96 | 9.0 ± 2.0 | 8.0 ± 1.6 | 8.2 ± 1.6 | 0.78 |
| e′ (cm/s) | 10.2 ± 3.0 | 8.9 ± 2.5 | 9.1 ± 2.6 | 0.73 | 11.0 ± 3.2 | 9.5 ± 2.8 | 10.5 ± 2.9 | 0.13 |
*P value for F/U1 vs. F/U2.
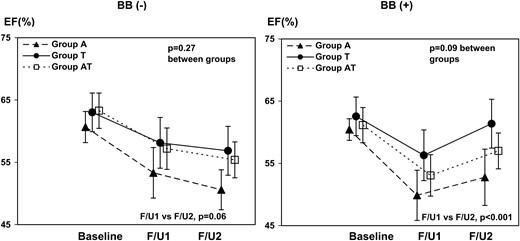
Trends of EF in three different chemo regimens, with or without beta-blocker. The changes in EF of patients with (right) and without beta-blocker (left) are shown. Each line represents the average response with each chemotherapy regimen. Error bar: 95% CI. BB, beta-blocker.
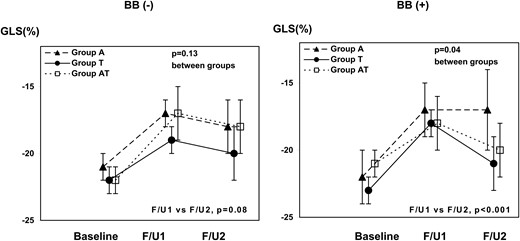
Trends of GLS in three different chemo regimens, with or without beta-blocker. The changes in global longitudinal strain (GLS) of patients with (right) and without beta-blocker (left) are shown. Each line represents the average response with each chemotherapy regimen. Error bar: 95% CI. BB, beta-blocker.
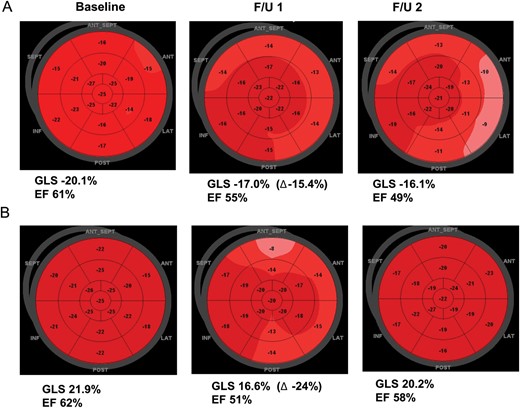
Representative cases with and without beta-blocker therapy. (A) A patient without beta-blocker therapy. There was a continuous deterioration of cardiac function. (B) A patient with beta-blocker therapy. There was a recovery of cardiac function at F/U2.
Discussion
The results of this study show that GLS can be used to document impairment of cardiac function in patients treated with anthracyclines, trastuzumab, or both. In addition, this is the first study to evaluate the echocardiographic (strain and EF) responses to treatment initiated in response to a reduction in myocardial deformation engendered by chemotherapy-induced cardiotoxicity. These observational data suggest that BB could facilitate the recovery of cardiotoxicity.
Cardiotoxicity
Cardiovascular toxicity remains a devastating complication of cancer treatment: heart failure in the setting of anthracycline therapy has a 2-year mortality of up to 60%, representing a 3.5-fold greater hazard when compared with patients with idiopathic dilated cardiomyopathy.22 With the availability of cure for many cancers, cardiovascular complications have become a major threat to patients surviving cancer.23 As a result, earlier and more sensitive methods of identification of patients at risk of future LV dysfunction are of paramount importance because these patients may benefit from intervention with cardioprotective regimens—or in extreme cases, changes to their cancer therapy. EF, mitral annulus velocities, and myocardial deformation indices have been shown to identify subclinical dysfunction in chemotherapy-induced cardiotoxicity.10,11,16,24,25 Our findings are concordant with the observations that the rate of heart failure and cardiac dysfunction is significantly higher in the group receiving both anthracyclines and trastuzumab than that in the group receiving trastuzumab only.24 The findings are also concordant with a literature that shows that both mitral annulus velocity and myocardial deformation can detect preclinical changes in LV systolic function, before conventional changes in EF.11,16 Indeed, of the 52 patients with a significant change of GLS in this study, only 14 had a decrement of EF that would have justified a diagnosis of cardiotoxicity based on standard criteria.
Responses to cardiotoxicity
Several interventions for the treatment of cardiotoxicity have been reported, using ACEi/angiotensin receptor blockers (ARB) and BB.15,26,27 The use of beta-blockade for patients with impaired LV function is a well-accepted strategy to prevent progression to heart failure.12 Animal studies have suggested a potential role of beta-blockade for prophylaxis of anthracycline cardiotoxicity.28 A recent meta-analysis indicated that a variety of agents, including BB and ACEi/ARB, were associated with a reduction in LV dysfunction and heart failure in patients undergoing chemotherapy.14 Two randomized, placebo-controlled trials to determine whether conventional heart failure pharmacotherapy could prevent trastuzumab-mediated LV remodelling among early breast cancer patients are in progress.29,30 In these studies, prophylactic BB is being administered before the initiation of cardiotoxic agents. The downside of this approach is that treatment of all patients is required to avoid the development of heart failure in a handful—in meta-analysis, only 4.5% of such patients developed symptomatic cardiotoxicity.31
The alternative approach is to monitor all patients and treat those who show an abnormal cardiac response. In one trial in which ACEi was initiated to patients with elevated troponin I after high-dose chemotherapy, early treatment with enalapril prevented the development of late cardiotoxicity.15 In our study, myocardial deformation was used as an early marker of subclinical myocardial dysfunction, which is related with subsequent deterioration in EF.16 Patients with an abnormal myocardial deformation response were divided into two subgroups based on their treatment with or without BB. Although there was a trend to decreasing in EF in patients without BB, there was a significant increase in EF of BB-treated patients. In addition, BB appeared to facilitate the recovery of myocardial function compared with those without BB, irrespective of the chemotherapy regimen.
Study limitation
Several limitations should be noted. This was an observational study, and as such has potential flaws relating to selection bias, unmeasured covariates, and non-random allocation to treatment. Nonetheless, this was a consecutive, prospectively acquired group with complete follow-up. The numbers of patients were relatively small. However, to our knowledge, this is the first attempt to use myocardial deformation as guide to the initiation and follow-up of cardioprotective therapy. As anthracyclines and trastuzumab are two major cardiotoxic drugs in clinical use, this study focused on these two drugs, but the effect of each individual drug was not tested in this study. Another limitation of this study was the exclusion of biomarkers. The importance of biomarkers for the detection of preclinical cardiac dysfunction is still controversial in trastuzumab-induced cardiotoxicity. Finally, the current implementations of speckle tracking have a number of limitations, including susceptibility to suboptimal image quality, temporal resolution, and differences among vendors.32
Conclusion
Both anthracyclines and trastuzumab therapy are conducive to reduced systolic function. A number of cardioprotective agents—including beta-blockers—have been proposed,14 and the findings of this study support the use of these treatments based on the findings of imaging surveillance (Figure 5). The results of this paper may assist the design of definitive, prospective, randomized studies of this strategy.
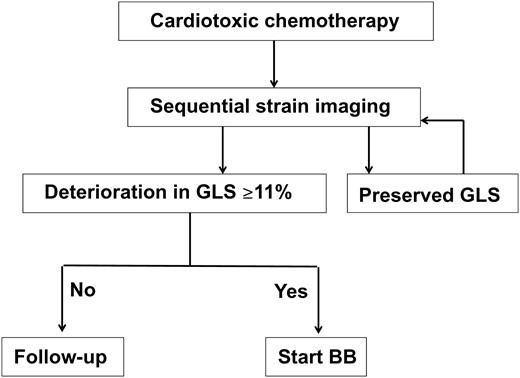
Proposed algorithm to guide cardioprotective therapy based on sequential evaluation of LV strain. Although findings of this study support the selection for treatment based on the findings of imaging surveillance, definitive prospective evaluation is required.
Funding
No external funding was obtained for this study.
Acknowledgement
We gratefully acknowledge the guidance of the clinicians and sonographers at Cleveland Clinic, Cleveland, OH, USA, Princess Alexandra Hospital, Brisbane, Australia, and Royal Hobart Hospital, Hobart, Australia.
Conflict of interests: None declared.
References
Author notes
The first two authors contributed equally to the study.
